

Satellite instruments provide observations of air pollutant and greenhouse gas concentrations in the atmosphere. We use these data to develop data-driven methodologies to estimate the emission from point sources.
Our focus areas are: Energy production, Mining sector, Oil&gas industry and Megacities.
Coal-burning power plants release large quantities of air pollutants and greenhouse gases from the combustion of fossil fuels. Emissions from such point sources can be quantified using atmospheric satellite observations.
Open-pit mining can cause emissions of nitrogen dioxide from the combustion of fossil fuels from stationary and mobile sources, explosions, and mineral processing in the mine quarries. In addition, coal mines can release methane through degassing (surface and underground mines) and ventilation systems (underground mines).
The oil&gas industry is responsible for large emissions of methane from leakages and venting from oil&gas fields and infrastructure. Excess gas is often burned in a process called gas flaring, which in turn produces nitrogen oxide emissions. Both gases can be monitored using satellite observations.
Megacities, defined as cities with more than 10 million inhabitants, are responsible for a large fraction of the total air polluting and greenhouse gas emissions. With increasing urbanization, monitoring emissions from cities, especially large ones, is becoming more and more important.
The TROPOspheric Monitoring Instrument (TROPOMI) onboard the EU Copernicus Sentinel-5 Precursor (S5P) satellite provides observations of short-lived gases (e.g., NO2 and SO2) as well as methane (CH4).
We use direct methods (that do not require model simulations) to estimate emissions from point sources based on satellite observations. Emissions of short-lived gases such as NO2 and SO2 can be derived using data averaged at annual level by using for example the divergence method (Beirle et al., 2019, 2021). Emissions of greenhouse gases such as carbon dioxide and methane are usually derived from individual plumes (see e.g. Nassar et al. 2017, Reuter et al. 2019, Hakkarainen et al. 2021, 2023).
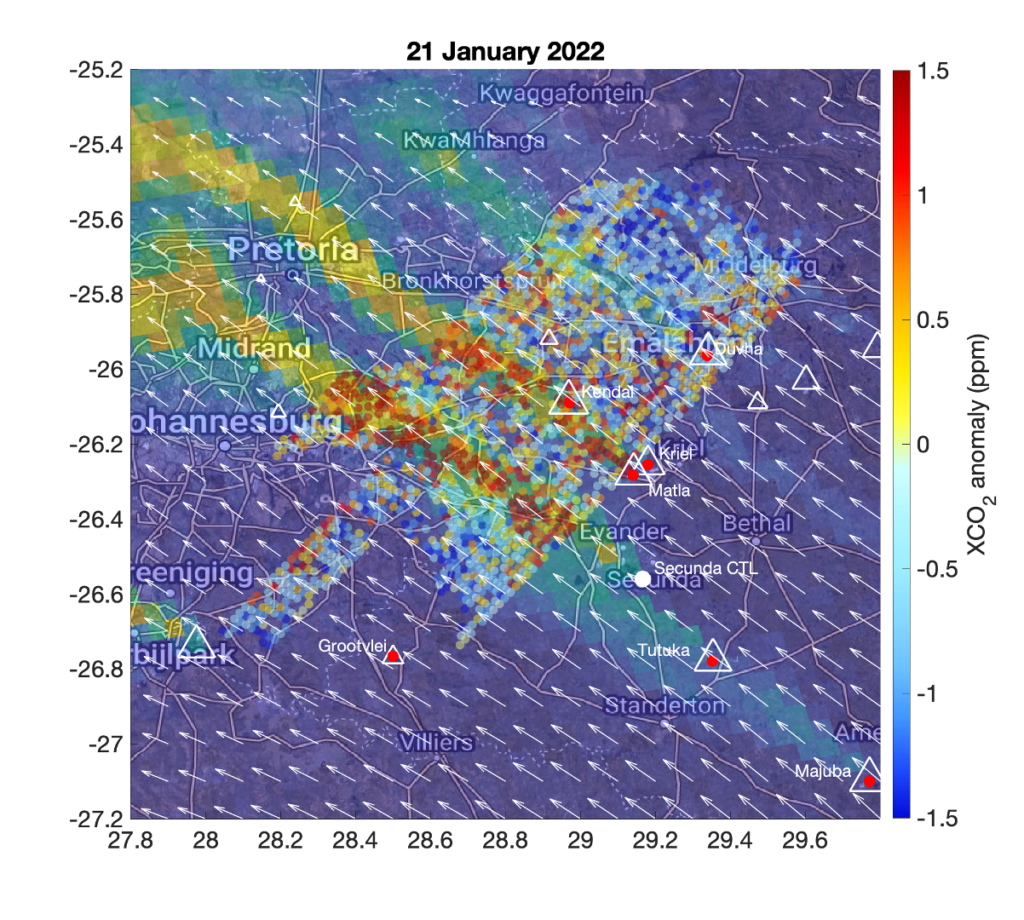
Picture: TROPOMI NO2 tropospheric columns overlayed with OCO-3 XCO2 SAM observations on 21 January 2022 showing the emission plumes from several point sources in the South African Highveld region (Hakkarainen et al., 2023). The white triangles indicate all the power stations in the area, with the marker size proportional to the power plant capacity. The red dots indicate the power stations analyzed in the study: Duvha (Du), Kendal (Ke), Kriel (Kr), Matla (Mat), Majuba (Maj), Tutuka (Tu), Grootvlei (Gr). The white dot corresponds to the Secunda CTL synthetic fuel plant.